
About this edition: This is a dated synthesis of public research, compiled by TV Installation Pros. It is not an original survey. The sources use different populations and measurement periods, which are shown beside each figure. Checked October 22, 2026.
TV and streaming statistics at a glance
A screen can serve several roles: streaming player, live-TV display, games console and shared family screen. Public research helps describe those uses, but a national audience figure cannot tell you how many people in Monterey are looking for an installer.
| Finding | Measure and period | Source |
|---|---|---|
| 83% watch streaming services | U.S. adults; April 2025 survey | [1] |
| 36% have cable or satellite at home | U.S. adults; same survey | [1] |
| 49.0% of TV usage was streaming | U.S. TV usage; Nielsen’s July 2026 interval | [2] |
| 132,489 households in Monterey County | Census QuickFacts; 2020–2024 period | [3] |
| 93.8% of Monterey County households have broadband subscriptions | Census QuickFacts; 2020–2024 period | [3] |
Streaming use and cable subscriptions can overlap
Pew Research Center surveyed 9,397 U.S. adults on April 14–20, 2025. Alongside the headline streaming and cable figures, it found that 55% streamed without a cable or satellite subscription, while 28% used streaming and also subscribed to cable or satellite. [1]
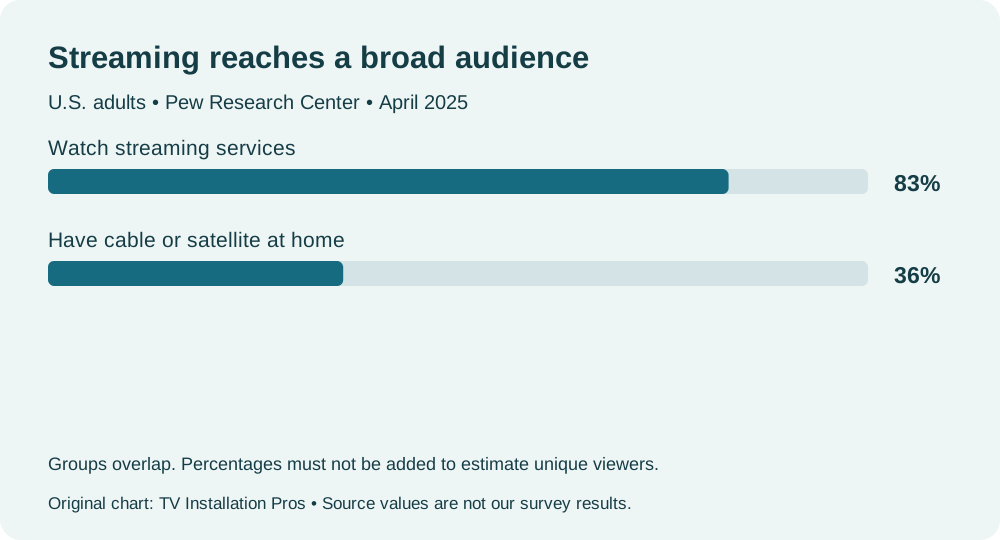
Planning interpretation: Ask which devices the household actually uses before choosing where to place a TV. A streaming-only arrangement and a setup with a cable receiver may need different shelves, remote-control access and cable routes. Neither percentage determines the correct mount or the strength of a wall.
Streaming accounted for 49.0% of TV usage in July 2026
Nielsen reported a 49.0% streaming share, a 19.5% broadcast share and an 18.7% cable share for its July 2026 interval, June 29–July 26. Its report was released September 10, 2026. These figures describe how total TV usage was distributed; they are not percentages of households that own a television. [2]
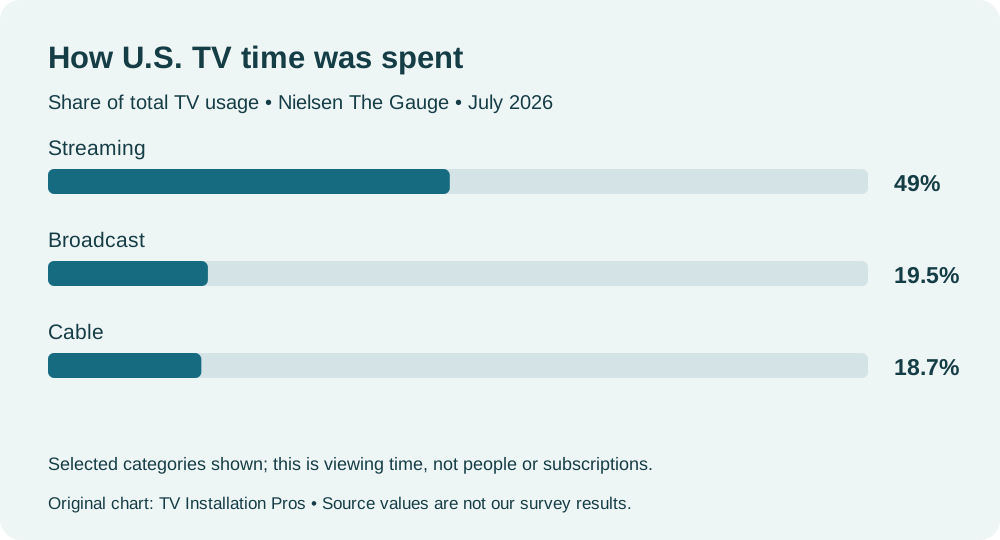
Planning interpretation: A room used for several types of viewing should be planned around the people and equipment in it. Leave access to connections that may need to change, consider soundbar clearance, and test reflections at the times the room is normally used. A popular viewing format does not create a universal screen-height rule.
A local snapshot: Monterey County households
U.S. Census Bureau QuickFacts lists 132,489 households in Monterey County for 2020–2024. It also reports a 93.8% household broadband-subscription rate and a 52.1% owner-occupied housing unit rate for that period. These are county-wide housing and connectivity measures, not a survey of our customers. [3]
Monterey County includes places beyond the Monterey Peninsula. Its figures should not be presented as city-specific results for Monterey, Carmel, Pacific Grove or Seaside. They also should not be multiplied by national streaming percentages to claim a measured local audience: one dataset describes households, while the Pew survey describes adults.
Practical local context: In a rental, establish the owner’s permission and any restoration requirements before wall work. In any home, check the specific wall, TV, furniture and equipment rather than treating county averages as an installation plan. Our rental-property guide covers the questions to settle first.
Turn a viewing plan into a room plan
Start with a short inventory: TV model, mount model, seating position, soundbar, receiver, game systems and any streaming boxes. Mark where each item will sit. Then decide which connections need to remain accessible after the screen is mounted.
- Position: compare the screen with seated eye level and furniture; our TV height calculator estimates screen edges, not drilling points.
- Support: the wall structure and the mount and TV manufacturers’ instructions govern attachment. Viewing statistics cannot determine a safe fixing method.
- Cables: choose an accessible route and check the suitability of components before concealment. See our cable-concealment service for project planning.
- Sound: allow room for the soundbar, its controls and the TV’s sensors. See soundbar mounting.
For a multi-purpose living room, test a full-size paper outline from each normal seating position. This simple check connects the proposed installation to the actual room. It is more useful than selecting a mounting height because it appears in a national trend story.
Methodology, limitations and chart reuse
We selected accessible primary sources that identify their measurement periods. Values are reproduced as published; we have not combined them into a market-size estimate, predicted installation demand or inferred which search app people use. The 2025 survey is retained as a clearly dated audience benchmark, alongside the 2026 viewing report. This page does not claim that every figure was measured in 2026 or that these are the latest figures available for every topic.
Our two charts were drawn specifically for this guide. They are not copies of the publishers’ artwork. You may reuse the TV Installation Pros charts with attribution to this guide and the underlying source; this permission covers our original graphic design, not third-party logos or source publications. If you cite a statistic, retain its population and date.
Download the source-checked data (CSV) · Download the audience chart (SVG) · Download the TV-usage chart (SVG)
Suggested attribution: Chart by TV Installation Pros, “TV & Streaming Statistics 2026”; underlying figures from Pew Research Center or Nielsen, as labeled. Link to this guide and the primary source when practical.
Primary sources and measurement notes
- Pew Research Center — streaming use and cable/satellite subscriptions. Published July 1, 2025. Survey of 9,397 U.S. adults, April 14–20, 2025; weighted to represent U.S. adults. Read its linked questionnaire and methodology for definitions.
- Nielsen — July 2026 The Gauge report. Released September 10, 2026. Reporting interval June 29–July 26, 2026; share of total U.S. TV usage, not unique people or subscribers.
- U.S. Census Bureau — Monterey County QuickFacts. Selected household, broadband and owner-occupancy measures are labeled 2020–2024. QuickFacts is updated over time; preserve the period when citing a value.
Compiled by TV Installation Pros, a business providing installation services at customer locations. This page’s practical planning commentary is ours; the statistics are credited to their original publishers. For corrections or an editorial contribution, email info@tvinstallationpros.com.